
I’m a huge fan of Google Trends, and one thing I recently stumbled upon are the stats on how and when people research the phrase “weight loss” on Google. The graph below shows the phrase’s trend pattern in the last ten years.
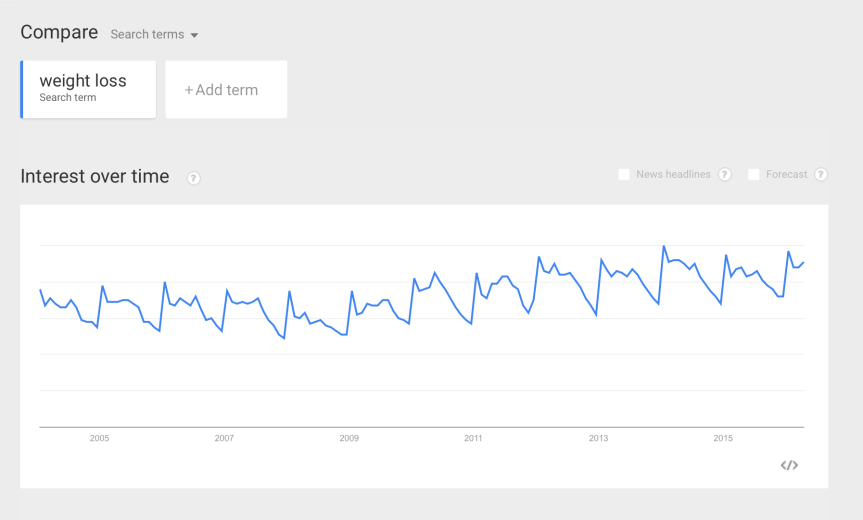
How crazy is this graph? Every deep drop is right around December, and every steep incline is January. Literally, every single one, year after year. It’s crazy to think how much “New Year’s Resolutions” impact us as human beings.
Next, I compared the phrases “diet” and “weight loss”, and got a similar outcome.
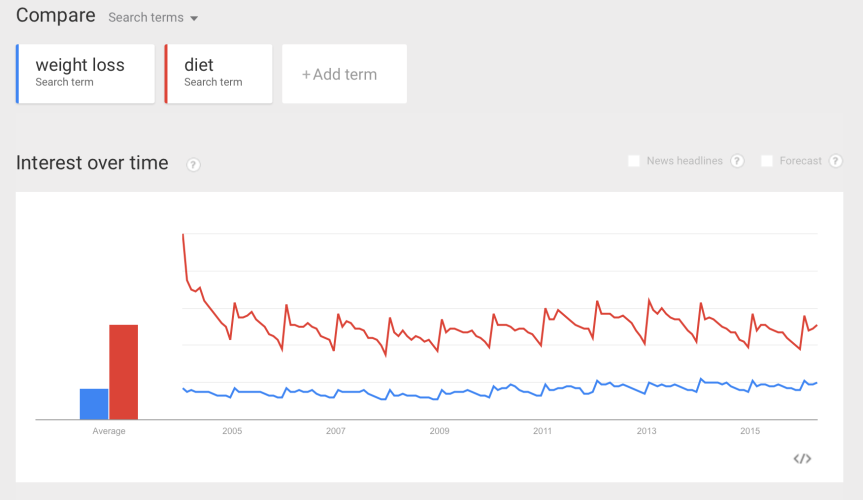
Interest drops in December, when people are surrounded by food, peaks in January when they’ve overeaten for a month, and then peaks again slightly in May, right before summer season where it plateaus for a couple of months before dropping again.
Just goes to show, we as humans, are pretty darn predictable.
Until next time,
PositivelyCurvy

Wow. Seeing the visual of that is pretty incredible. No wonder the gyms are crowded Jan. 1st haha
LikeLike